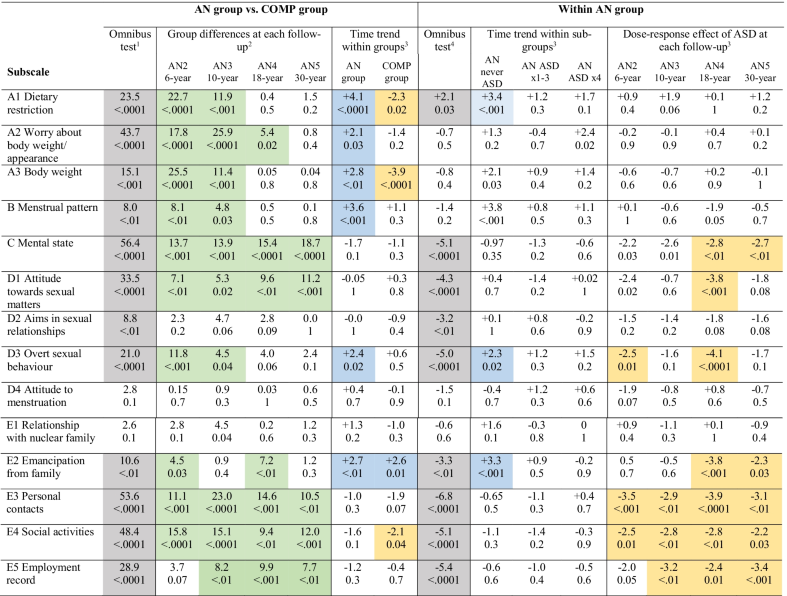
- Within each cell, the upper value represents the test statistic, and the lower value represents the exact p value. Significant omnibus tests are highlighted in grey. Follow-up tests are highlighted only if the omnibus test was significant. Positive trends are highlighted in blue, negative trends are highlighted in yellow, differences between the AN group and the COMP group are highlighted in green
- AN: anorexia nervosa; COMP: comparison; ASD: autism spectrum disorder; AN 2: AN Study 2; six-year follow-up study (AN: n = 51; COMP: n = 51); AN 3: AN Study 3; 10-year follow-up study (AN: n = 51; COMP: n = 51); AN 4: AN Study 4; 18-year follow-up study (AN: n = 51; COMP: n = 51); AN 5: AN Study 5; 30-year follow-up study (AN: n = 47; COMP: n = 51). Year of data collection: AN Study 2: 1991–1992; AN Study 3: 1995–1996; AN Study 4: 2003–2004; AN Study 5: 2015–2016. ASD × 4: Individuals in the AN group with an ASD diagnosis at AN Study 1 to AN Study 4 (all four examinations) (n = 6); ASD × 1–3: those who had been assigned an ASD diagnosis at least once and at most three times (n = 10); never ASD: those who had never fulfilled criteria for ASD (n = 34)
- Each statistical analysis was unique, involving a specific ‘research question’, and type I errors were therefore not taken into account
- 1Generalised Cochran–Mantel–Haenszel test for a singly ordered R × C table
- 2Kruskall-Wallis test for a single ordered R × C table
- 3Linear-by-Linear association test for a doubly ordered R × C table
- 4Generalised Cochran–Mantel–Haenszel test for a doubly ordered R × C table
